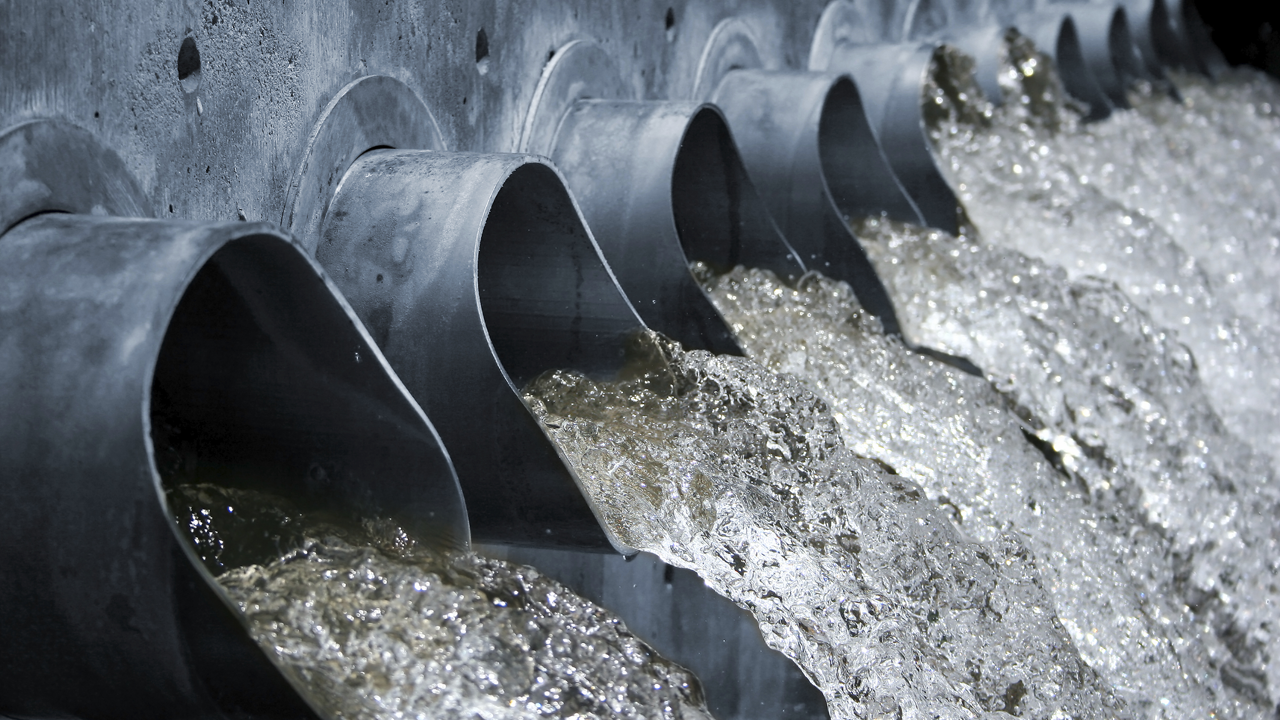
Cities around the nation are grappling with the need to maintain and renovate the often-overlooked infrastructure that supports services like drinking water and sewage systems. In extreme situations improperly maintained systems can result in health hazards like those caused by the water quality crisis in Flint, Mich. In Minnesota, 5.5 million people depend on the state’s aging infrastructure, which will require maintenance and replacement over the next few decades to stay safe and reliable.
A new online resource will make it easier than ever for Minnesotans to find and interpret information about infrastructure across the state. Developed through a collaboration between the University of Minnesota and the Office of the State Auditor, as well as other partners including League of Minnesota Cities, MN 2050 and numerous state agencies, the Infrastructure Stress Transparency Tool brings together data from across the state in a single, visual format that can help city administrators, legislators and Minnesota residents understand pressing infrastructure needs and make informed funding and policy decisions based on that knowledge.
“It’s the first time anybody has mapped these data,” said Len Kne, principal investigator on the project and associate director of U-Spatial. “This tool can bring awareness to the vast amount of infrastructure across the State of Minnesota and can inform the discussion on how to meet maintenance and replacement needs.”
Data on the interactive map shows up as color-coded points that indicate the size and age of infrastructure systems across the state. Clicking on a city brings up more information, such as charts on how much drinking water the city produces on an average day, how many miles of sewer system the city has and whether the usage fees cities charge cover the cost of running these systems.
The tool is a one-stop source for existing data from state offices such as the Department of Health, Minnesota Pollution Control Agency, the Public Facilities Authority and the State Auditor’s Office. For a resident, mayor or policymaker to find this breadth of data before, he or she would have had to search extensively through individual reports and record the data by hand for every one of the cities and infrastructure systems involved. By making this information significantly easier to find and understand, the new tool can help illuminate the condition of the state’s less-visible systems.
“With underground infrastructure out of sight, it tends to also be out of mind — we take it for granted that the faucet will provide clean water and the toilet will flush,” said Rebecca Otto, Minnesota’s State Auditor. “In reality, these aging systems will need our attention in the coming years, and they are very expensive to maintain and replace. Understanding where we are comprehensively today with the state of our infrastructure will allow for better planning, better policy, and better outcomes for our communities.”
During a tour of several cities in late 2015, Kne, State Auditor Rebecca Otto and experts from the state agencies that provided data for the tool took an early version on the road to get feedback from city officials and engineers. The tour spanned Alexandria, Buffalo, Austin, Fairmont, Worthington, New Ulm and St. Paul, garnering an enthusiastic response from those who were able to review their own city’s data and compare it to data in similarly-sized or nearby cities.
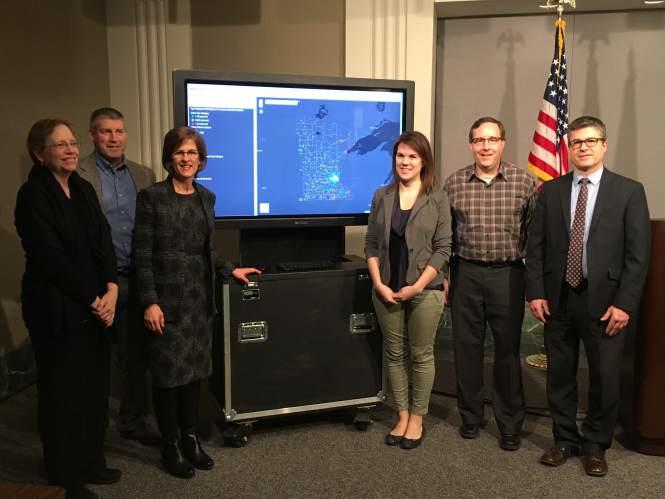
Collaborators gather around a screen showing the newly released Infrastructure Stress Transparency Tool. From left: Rebecca Sabie, program coordinator with the Public Facilities Authority; Bill Dunn, Clean Water Revolving Fund Coordinator with the Minnesota Pollution Control Agency; State Auditor Rebecca Otto; University graduate student Kathryn Stinebaugh; U-Spatial Associate Director Len Kne; and John Jernberg, research analyst with the Office of the State Auditor.
The Spark of Serendipity
The Infrastructure Stress Transparency Tool project launched out of a serendipitous discussion between University researchers, State Auditor Rebecca Otto and other collaborators during the U’s Convergence Colloquia event on Smart Cities and Infrastructure. The event brought together experts, practitioners and community leaders from across the public, nonprofit and private sectors to discuss how to create and integrate communities that are more intelligent, efficient and livable.
“In this case, the smart cities and infrastructure colloquium was instrumental in forming the connections and spurring the discussions that launched this collaborative effort,” said Carissa Slotterback, Ph.D., director of Research Engagement at the U and organizer of the Convergence Colloquia. “One of the strengths of the Convergence Colloquia is that they allow experts from across disciplines and sectors to explore the opportunities around how technology and data sources can address our society’s major challenges.”
Following the Convergence Colloquia event, a Serendipity Grant from the University helped launch the project. The grant provided funding for Kathryn Stinebaugh, a public health graduate student with a master’s degree in geographic information systems, to collect, process and input the data. Going forward, collaborators are seeking additional resources to refine the tool with more data, such as road and bridge infrastructure.
To use the Infrastructure Stress Transparency Tool, visit the Office of the State Auditor’s website.