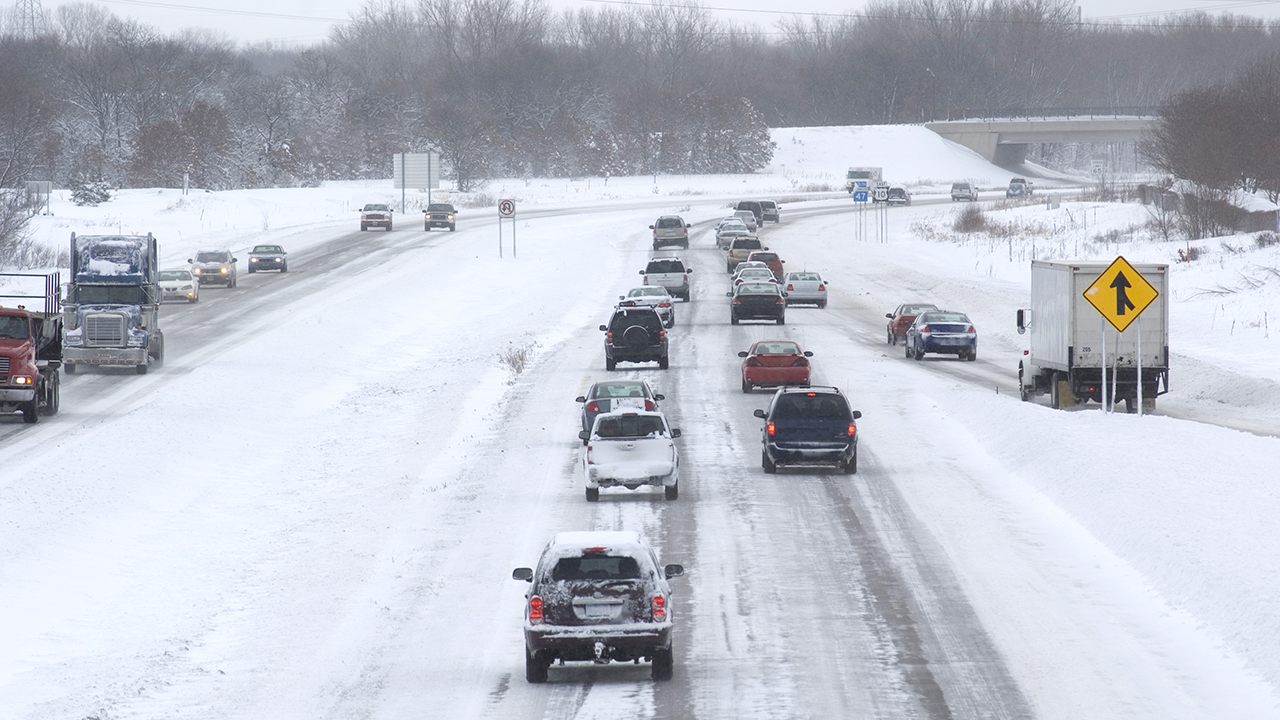
Is it safe to fly to Arizona? What about driving to Chicago? For most of the past year, concerns around the spread COVID-19 have focused on questions like these, aiming to determine the effect of long-distance travel. But what about shorter trips, such as essential workers’ daily commute or a visit to a state park?
Two University of Minnesota researchers and their collaborators have built a framework to better answer that question—not just to assist with the current pandemic, but to have at the ready for future public health emergencies. Raphael Stern, PhD, and Michael Levin, PhD, both scholars in the Center for Transportation Studies and assistant professors of civil, environmental, and geo- engineering in the College of Science and Engineering, enhanced existing computer models of disease spread by adding in high-resolution data on short-distance transportation. The models can better show the effects of local travel and help inform decision-making to address disease spread.
Stern and Levin collaborated with researchers at Purdue University on the project. The models were developed through funding from the National Science Foundation’s RAPID, a grant program designed to quickly provide support for research that addresses an urgent need.
Only recently has technology made it possible for models to incorporate a greater level of detail on short-distance transportation, Stern said. In the past, in-depth data often came from asking a sample of people to log their trips, but that data only spoke to a snapshot in time. Data from before the pandemic, for example, would become useless once behaviors changed in response to COVID. Automated roadway sensors provided real-time information, but they could only indicate how many vehicles passed through a specific point.
“Roadway sensors really don’t tell us where those people are coming from and where they are going; they just tell us the broad, directional flow of traffic,” he said. “It used to be that guessing where people were going was really quite difficult.”
That started to change about 10 years ago, when smartphones began to include GPS. Today, the vast majority of people carry a mobile phone with this location technology. Aggregator services collect this GPS data in bulk, strip it of identifying information, and combine it all together to creating anonymized data sets, which are perfect for gleaning big-picture insights about population travel without giving detail particular to any one phone’s movements. They can, for example, gauge roughly how many people are traveling from Hennepin County to Ramsey County, as essential workers might for a commute.
Stern and Levin used these data sets to plug real-time information on the origin and destination of short-distance trips into disease models. The fact that the data updates to reflect changes in behavior is ideal for pandemic conditions, where changes in local restrictions, travel advisories, and economic activity can dramatically alter how and when people use transportation.
“Having that next level of data really allows you to go a lot deeper,” Stern said. “Anytime you have more information about where people are moving, that allows you to create models that are more accurate in terms of where people are interacting and where the virus is spreading from once place to another.”
Running Through Scenarios
Once more detailed short-distance transportation data is plugged in, the model uses statistics on the current infection rates in each county to estimate the portion of people traveling between counties that will carry the virus. The model also factors in COVID-19’s incubation time, its typical disease duration, and other epidemiological considerations to gauge how likely the virus is to spread.
Even with better data, however, models cannot see the future. They rely on the information experts feed into them, a set of baseline conditions used as a starting point for the calculations that attempt to forecast what may happen next—and even experts cannot always account for human behavior.
Back in July, for example, Stern and Levin’s model anticipated the virus situation would be better in November than it actually ended up being. The problem was that the model assumed people would continue to reduce travel as they had been in July, Stern said, but many instead suffered COVID “caution fatigue” and began to resume more frequent travel.
“Modeling is as much of an art as it is a science,” Stern said. “With forecasting, one of the things that you need to feed into it is how people are going to behave. It’s really, really difficult to predict that.”
What experts can do more reliably, however, is run several different scenarios through the model that represent a range of potential conditions, such as what would happen with a lower amount of travel versus a higher amount. Understanding how transportation would factor into each possibility can ultimately help inform ways to limit the virus’s harm, such as through changes to health care policies, restrictions on gatherings, resource allocation, and guidance on whether travel, even for short distances, should be postponed.
Stern said the team’s model hasn’t been used to guide policy yet. The current research timeline makes it likely the model will play a larger role in informing decisions for future pandemics.
Reaching this point, Stern said, was only possible through collaboration. He and Levin depended on the virus modeling expertise of their collaborators from Purdue throughout the project. This effort wasn’t an outlier in that sense—for many projects, transportation engineering is only part of the overall puzzle, he said.
“In order to solve these societal-scale problems, you need experts from different disciplines to be able to work together,” he said. “No complex problem is simple enough that one person or one set of tools can solve it.”