The Vice President for Research and Innovation tracks key research metrics for the University of Minnesota, including national rankings, proposals and awards, sponsored expenditures, and technology commercialization performance measures. Several of these metrics are part of Commitments 2 and 3 in the University’s MPact 2025 dashboard and progress card.
In December 2023, the University announced that it had successfully competed for $1.13 billion in external research funding in fiscal year (FY) 2023, the second largest total in history and a 7% increase over the previous year. The UMN Twin Cities campus also rose two spots in the latest NSF ranking to 12th among US public research universities.
- See the press release: U of M marks research growth and shares plans for increased impact
- See more tech transfer statistics on the Technology Commercialization website
- Faculty and staff seeking detailed data, including college level statistics from previous years, can access the RIO Research Reporting Center
Vice President for Research and Innovation Shashank Priya presented an analysis of the University’s FY23 research and technology transfer work to the Board of Regents at its December 2023 meeting. Watch the presentation from December 7, 2023 or see presentation slides, Research At-A-Glance, and the printed annual report.
Research Awards
A $1.13 billion research award total in FY23 represents a year-over-year increase and the third year of awards over $1 billion.
Awards by Source: All Campuses, FY23
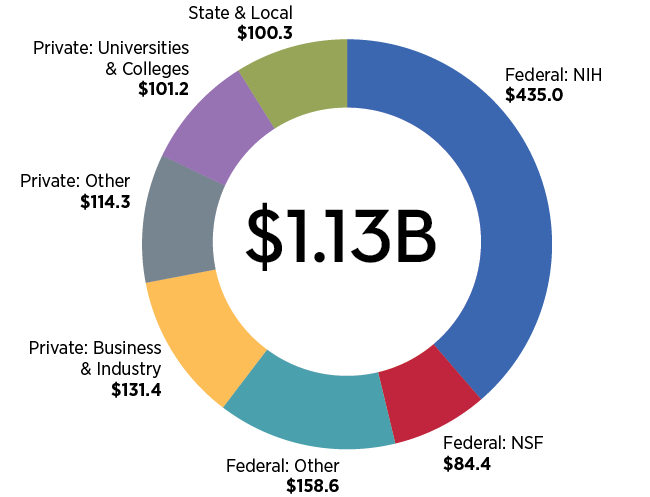
Federal agencies remained the largest source of awards, comprising approximately 60% of all award funding. Among all federal agencies, National Institutes of Health (NIH) ($435.0M) and the National Science Foundation (NSF) ($84.4M) awarded the most support. The Federal: Other category includes: health and human services ($36.9M), agriculture ($35.4M), defense ($27.2M), energy ($19.4M), and education ($12.4M). The $131.4 million in business and industry funding increased 41.9% from FY22, with significant COVID-19-related pass-through funding from NIH.
Over a five-year period (FY19-FY23), the University’s awards have grown by 30.0%, including a 25.0% increase in the number of high-dollar awards.
Awards by College and Campus: All Campuses, FY23
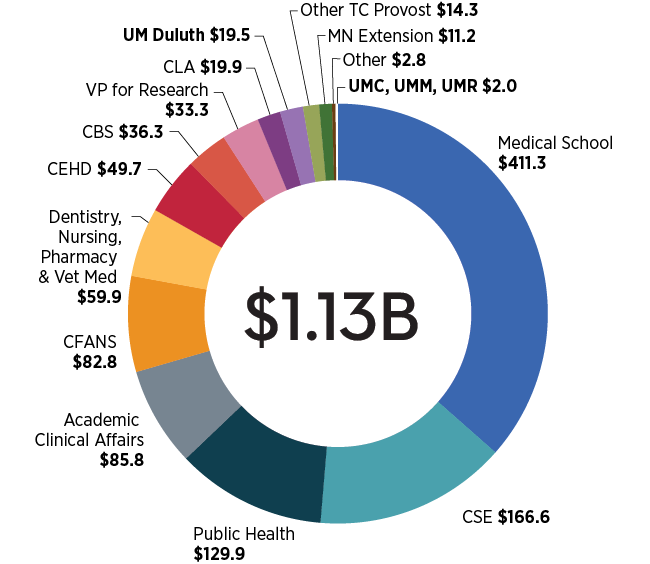
In FY23, 61% of UMN research awards went to medical and health science-related units. Colleges with the largest annual percentage increases in research funding include: the Medical School, up 33.1%, the College of Science and Engineering (CSENG), up 9.0%, and the School of Public Health, up 12.6%.
R&D Expenditures
Research expenditures, which include both external awards and internal institutional funding and are gathered then published by NSF in the following year, were $1.202 billion for the Twin Cities campus and $1.227 billion across all campuses in FY22.
Based on those expenditures, the University’s Twin Cities campus rose from 14th ranked to 12th ranked among US public research institutions in the NSF/HERD survey. Interestingly, if all UMN campuses’ expenditures were added together, they would nearly match those of 11th ranked University of Maryland.
UMTC ranked 10th among the same group according to another ranking, the Academic Ranking of World Universities (ARWU/Shanghai), and 44th among all world universities.
Top US Public Research Institutions
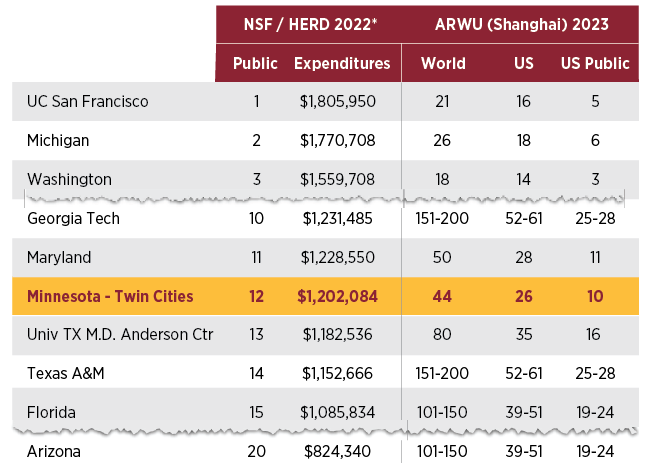
*Higher Education Research and Development Survey (National Science Foundation), Academic Ranking of World Universities
Research Priorities
Vice President Priya has a number of priorities aimed at growing the University’s research enterprise and increasing its impact. Among them are:
- Improving research capabilities by bringing UMN research infrastructure, particularly for preclinical research, up to the standards of peer institutions, expanding shared research facilities, implementing the recommendations of the UMN Faculty Burden Reduction Committee to reduce research-related administrative burdens, and implementing the MN-GEMS grant management system.
- Consulting with UMN constituencies in spring 2024 on the feasibility of creating a faculty-led National Security Institute and implementing other recommendations that could better attract and accommodate projects from the Department of Defense and other security-related agencies.
- Using the 14 high impact research themes that emerged from the recent Research 2030 workshop as a strategic framework to launch new research initiatives, including a new Biotechnology and Biomanufacturing Innovation Center (BBIC), and a Sustainable Development Goals Geodesign Consortium.
- Engaging with industry partnerships through the Corporate Engagement Center.
- Exploring research partnerships with tribal colleges and communities, and Historically Black Colleges and Universities (HBCUs); and continuing RIO’s Social Justice Impact Grant program.
- Taking UMN technology commercialization work to the next level of success through a program called Discovery to Impact, which will raise philanthropic funds and venture capital to shepherd more inventions and startup companies to market success.
- Establishing a new headquarters for the Research and Innovation Office in the McNamara Alumni Center.
Technology Commercialization
University-developed technologies reach the market through UMN Technology Commercialization, which facilitates the transfer of University research to licensee companies for the development of new products and services that benefit the public good, foster economic growth, and generate revenue to support the University’s mission.
See UMN Technology Commercialization statistics for new tech transfer metrics for FY23.
The University’s technology transfer work has been recognized for its excellence in national and global rankings, including:
- UMN is in the top 20 public universities for five key tech transfer metrics: startups (3rd), deals (7th), disclosures (11th), New Patent Applications (16th), and License Income (17th); AUTM 2022 Survey
- 18th globally for universities granted US Utility Patents and 4th among Big Ten public institutions; National Academy of Inventors Top 100, 2022
- First for technology transfer within the 20-state heartland region, and fifth among all US public universities; Heartland Forward 2022
- The University has spun out more than 230 startups since the formation of the Venture Center within UMN Technology Commercialization in 2006
- The University’s MPact 2025 plan has set a goal of spinning out 25 startups annually by 2025, and the University is on a path to meet that goal